Oil and gas production is becoming more complex. Deep reservoirs, high water cut, low resource density, frequent geological disturbances, increased water or CO₂ injection — these challenges demand a new approach to downhole monitoring.
For producing wells, uneven production along the well section, early gas or water breakthrough, and rapid water-cut increase can directly reduce productivity and economic performance. Production logging — used after a well is put into operation to understand downhole flow profiles — is the critical diagnostic tool. Typical parameters include flow velocity, flow rate, density, water holdup, temperature, and pressure.
Conventional logging tools provide valuable point data, but they may not fully capture long-distance, time-varying, and spatially distributed wellbore behavior. This is where distributed fiber optic sensing enters the picture.
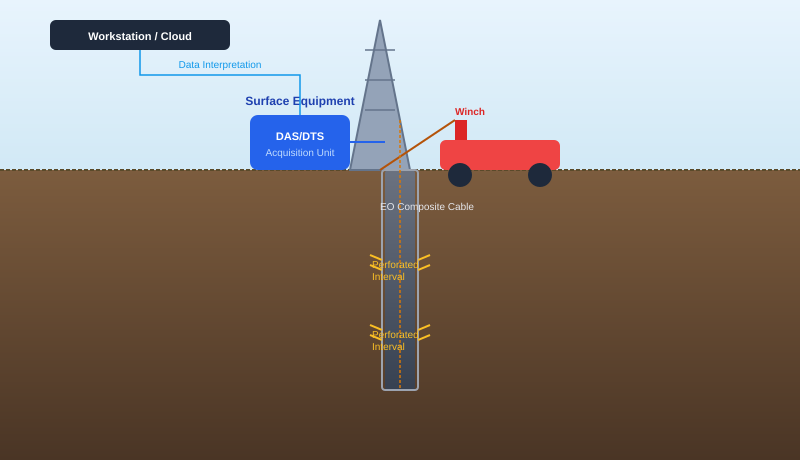
One Composite Cable Connecting the Downhole Environment with Surface Interpretation
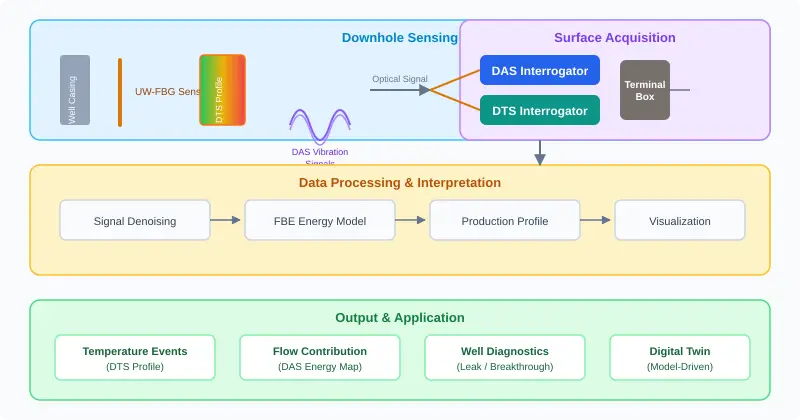
The proposed fiber optic production logging system consists of:
- A downhole logging head
- A special electro-optical (EO) composite logging cable
- A terminal box on the winch
- Ground acquisition equipment (DAS/DTS interrogators)
- A data interpretation system
Its purpose is not to simply replace conventional logging instruments, but to add a distributed, long-distance sensing channel with small diameter, high-temperature resistance, high-pressure tolerance, corrosion resistance, electromagnetic immunity, and continuous measurement capability.
In this architecture:
- DAS (Distributed Acoustic Sensing) captures acoustic and vibration responses associated with downhole flow, production events, and VSP-type measurements.
- DTS (Distributed Temperature Sensing) records the distributed temperature profile along the wellbore, supporting temperature-event tracking and production-interval interpretation.
- Pressure logging models help determine fluid properties, pressure gradients, fluid interfaces, and inter-layer pressure communication.

Key Technical Building Blocks
The core of this system is the UW-FBG (Ultra-Weak Fiber Bragg Grating) array, which enables both DAS and DTS measurements through a single optical fiber. Unlike conventional FBGs that require expensive apodized gratings and are limited in quantity, UW-FBG arrays can have tens of thousands of weak gratings written along a single fiber, enabling true distributed sensing.
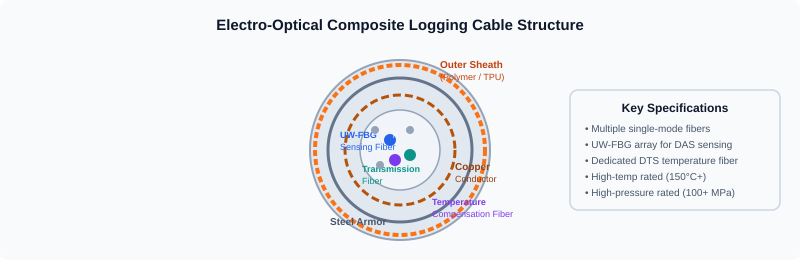
The electro-optical composite logging cable integrates:
- Multiple single-mode sensing fibers — UW-FBG arrays for DAS
- Dedicated DTS fibers — separate fibers optimized for temperature measurement via Raman or Brillouin scattering
- Transmission fibers — for optical data relay from the downhole head
- Copper conductors — for power delivery to the downhole logging head
- Steel armor layers — protecting the optical fibers under downhole pressure and mechanical stress
- Outer polymer sheath — chemical and abrasion protection for deployment in harsh wellbore environments
From Temperature Profiles to Production Events: Field Observations
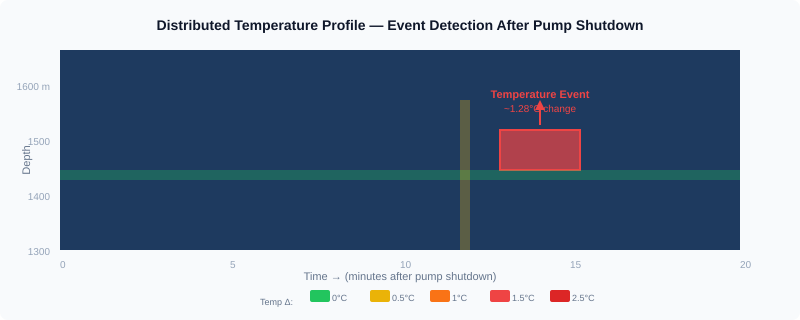
The field analysis shows that during pumping, the downhole UW-FBG cable temperature variation was generally within 0.5 °C in the deeper section, while the wellhead area fluctuated by about 2 °C due to ambient conditions. The response was broadly consistent with the DTS temperature results.
When pumping stopped, a clear temperature event appeared at approximately 1312.5 m, where the temperature change exceeded 1.28 °C. Afterward, the temperature continued to rise and expanded upstream, with the maximum temperature change approaching 2.5 °C. DTS also confirmed the event, but with a slower response and greater depth error near the bottom section.
The comparison concluded that UW-FBG temperature sensing responded faster than Raman DTS, and the two methods showed about 14 m deviation in event positioning, mainly caused by DTS baseline deviation at the bottom.
DAS Energy Analysis: Visualizing Downhole Flow-Related Responses
The DAS interpretation workflow uses a frequency-band extracted (FBE) energy model. A production data segment is selected, transformed using Fourier analysis, and then evaluated within selected frequency bands. The FBE energy is calculated for different production-state segments and compared with shut-in-state energy to estimate the relative contribution of different production depths.
The field data included energy maps across four frequency bands:
| Frequency Band | Observed Behavior | Interpretation |
|---|---|---|
| < 10 Hz | Clear boundary between pumping and shut-in; delayed low-frequency response after shutdown | Low-frequency flow energy, sensitive to bulk fluid movement |
| 10 – 20 Hz | High-energy zones near ~50 m below wellhead | Near-wellhead turbulence and flow restriction |
| 20 – 50 Hz | Energy concentration in the 700–1200 m range | Main production interval showing active flow |
| > 50 Hz | Low signal-strength feature near the 1300 m temperature event zone | Thermal event with minimal acoustic signature |
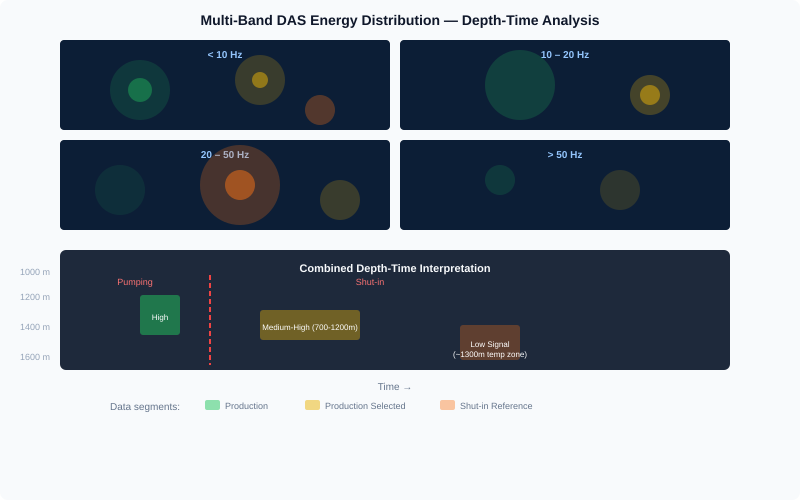
This transforms downhole behavior into a depth-time-frequency map — far richer than single-point measurements from conventional tools.
Value for Oil and Gas Production Management
- Provides distributed temperature and acoustic/vibration information along the wellbore
- Supports production-profile interpretation for producing and injection wells
- Helps identify temperature events, flow-response changes, and production-state transitions
- Offers a long-distance, electromagnetic-immune sensing channel compared with dense electronic point sensors
- Supports water-control, production optimization, wellbore diagnostics, and digital oilfield workflows
Key insight: The ability to visualize downhole behavior as a continuous depth-time-frequency map rather than discrete point measurements opens new possibilities for production optimization and early problem detection.
Conclusion
Production logging is evolving from periodic, point-based measurement toward continuous, distributed, and model-driven wellbore evaluation. UW-FBG-based DAS/DTS systems and electro-optical composite logging cables provide a practical pathway for acquiring distributed temperature, vibration, and production-response data.
The field observations indicate clear advantages in temperature-event response and real-time behavior, while DAS frequency-band energy analysis provides a visual method for identifying downhole production dynamics. For operators seeking better well performance evaluation, distributed fiber optic production logging is an important direction for next-generation digital oilfield monitoring.
Interested in UW-FBG Distributed Sensing for Your Well?
Our engineers can help design a custom fiber optic production logging solution for your specific well conditions. Contact us to discuss your application.
This article is adapted from a production logging technical proposal and rewritten for an international B2B audience. It explains how ultra-weak fiber Bragg grating-based DAS and DTS, together with a logging electro-optical composite cable, can support distributed temperature, vibration, and production-profile monitoring in oil and gas wells.